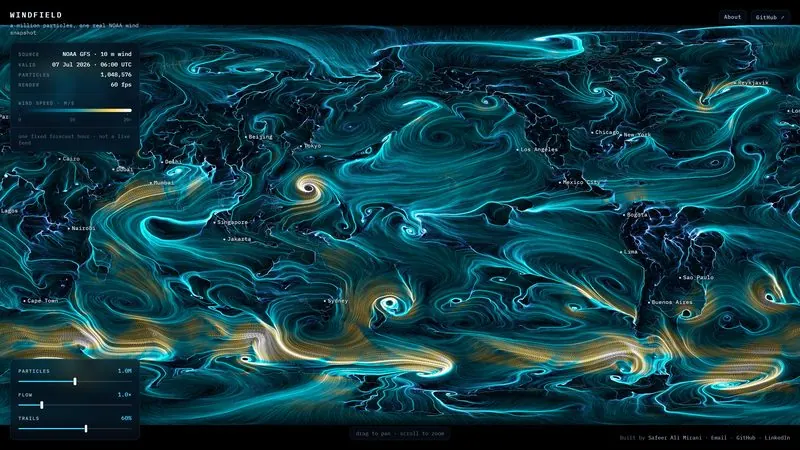
Windfield moves about a million particles through one real hour of global wind from NOAA’s GFS forecast, in the browser with WebGPU.
A short Python pipeline takes a subset of the forecast (wind at 10 m, regridded to 360 by 180 points) and packs it into a small image. A hand-written WGSL compute shader then reads the wind under each particle and moves it forward every frame, leaving fading trails that show the flow.
It shows one fixed forecast hour, not a live feed; running the pipeline again refreshes it to the latest forecast. Coastlines come from Natural Earth.
Data: NOAA GFS (public domain); coastlines from Natural Earth.
Lab demos are working experiments that show the methods behind our products. The same techniques can be built into software for your organisation.
See all demos →